
IBM Planning Analytics Workspace is the web-based interface for Planning Analytics. The tool expands on the capabilities of Architect and Planning Analytics for Excel (PAfE). Workspace (PAW) enables users to administer their server, create dashboards and visualizations, develop and maintain TM1 objects, and create applications and plans, directly from the interface.
Read More about Workspace here.
January: Visualizations
Planning Analytics Workspace version 2.0.83 released better functionality for creating customized bubble, scatter, line, and column visualizations in the Reports and Analysis section.
Bubble and Scatter added functionality:
- Added a zoom bar, enabling users to highlight a confined area.
- Added bubble size limitations to improve readability.
- Broke out the original “show grid lines” property into “show item axis grid lines” and “show value axis grid lines.”
Line and Column added functionality:
- Added a zoom bar, enabling users to highlight a confined area.
- Added the ability for users to display column value and point value labels as values or percentage of a category or color.
- Added the ability to toggle on/off if the line and column sections display zero in the same position, enabling users to highlight precise values.
- Added the ability to alter the line width, contributing to more compelling visualizations.
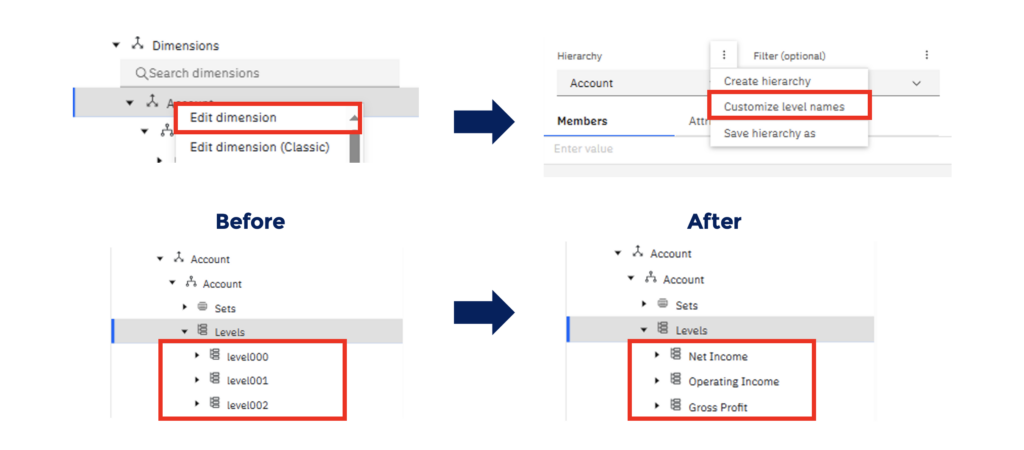
February: Modeling
Planning Analytics Workspace version 2.0.84 released functionality enabling users to copy (CTRL + C) every database object directly from the databases tree (e.g., database name, cubes, dimensions, subsets, views, chores, processes, etc.) and customize the hierarchy level names in dimensions using the new dimension editor.
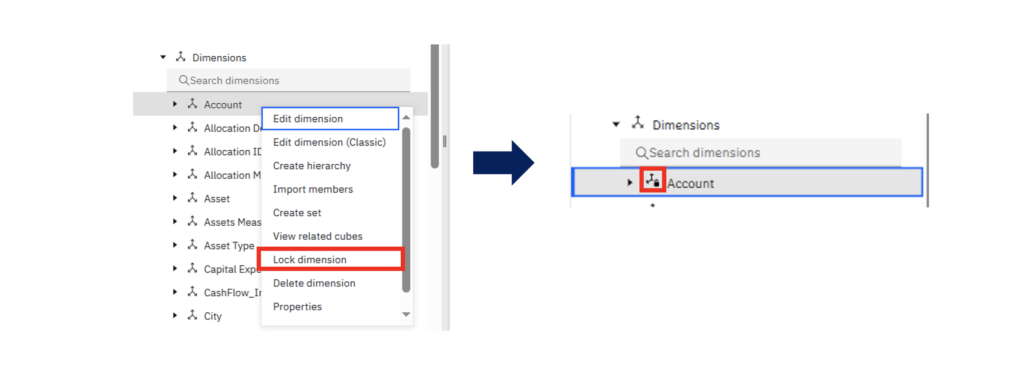
March: Lock Dimensions
Planning Analytics Workspace version 2.0.85 released functionality for administrators to lock dimensions which prevents users from modifying the dimension. When a dimension is locked, users who do not possess admin rights are unable to add members, remove members, create hierarchies, and delete hierarchies from the dimension. However, users with read permissions are still able to modify (create, delete, or update) the subsets deriving from the locked dimension. Only administrators can lock and unlock a dimension.
April: Git Integration
Planning Analytics Workspace version 2.0.86 released a Git repository integration for users to add database objects (cubes, dimensions, processes, chores, and certain control objects) to GitHub, Microsoft Azure, or AWS Code Commit. This promotes collaboration, productivity, and better control over database objects.
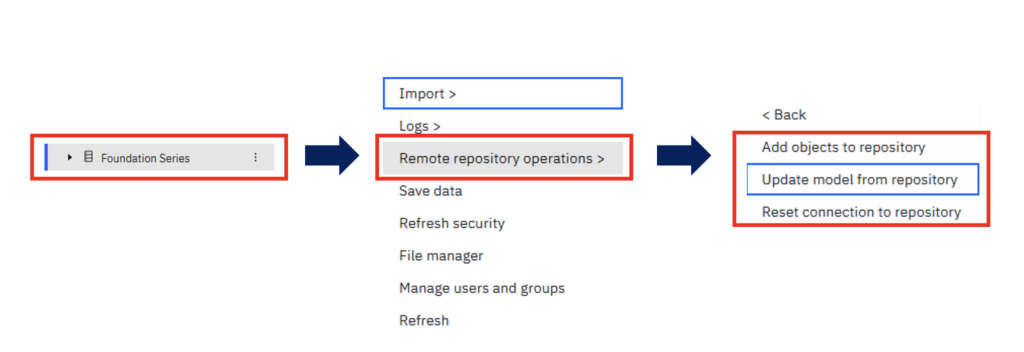
Action | Result
| Considerations |
Add objects to a repository | All objects are added to your repository. | Data and attributes are not included when adding objects to a repository. |
Update model from repository | Add objects from your repository to your database. | Unable to select specific objects, instead every object from the repository branch is added. |
Reset connection to repository | Closes the Git repository connection and removes the stored authorization credentials. | N/A |
The Git integration:
- Tracks changes over time, facilitating a reliable audit trail (version control).
- Enables code and process control.
- Promotes automation by managing and moving database objects without having to stop/restart the server.
- Improves collaboration and teamwork.
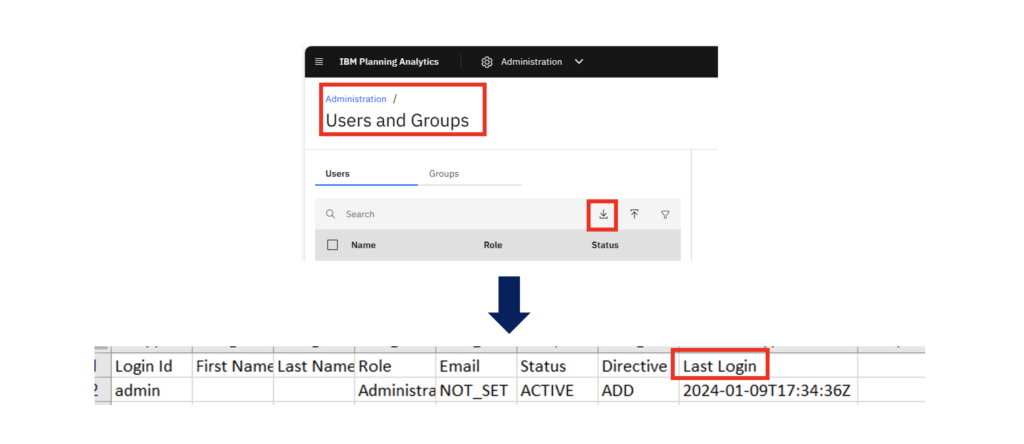
May: Administration
Planning Analytics Workspace version 2.0.87 released functionality that will display the last login date for every user on the Planning Analytics Workspace environment. This information can be downloaded by administrators in the User and Group section. This visibility improves database security and can aid in troubleshooting.
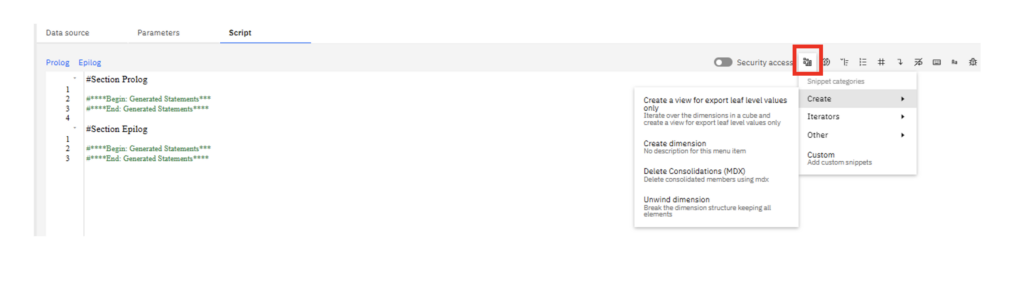
June: TurboIntegrator UX
Planning Analytics Workspace version 2.0.88 released functionality that will help TM1 developers write TurboIntegrator scripts. Developers can now use the Snippet icon in the process editor as a wizard for simple processes (e.g., create a view for exporting leaf level values, create a dimension, unwind a dimension, check if attributes exist, etc.) and as a way to bring in custom code that they use often (uploaded in JSON format).
See upload process here.
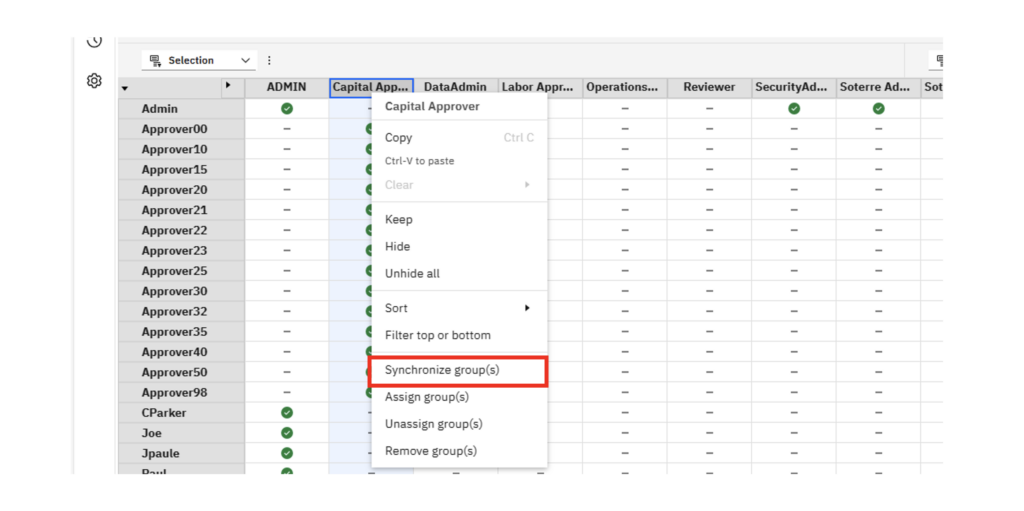
July: Security
Planning Analytics Workspace version 2.0.89 released functionality to simplify security maintenance, enabling administrators to synchronize user groups in Planning Analytics databases with Planning Analytics Workspace directly from the modeling workbench. ADMIN, DataAdmin, SecurityAdmin, and OperationsAdmin groups are unable to be synchronized. When you synchronize groups, existing users in the Planning Analytics Workspace group that are not in the database are also added to the database.
August: N/A
IBM did not release a new version of Planning Analytics Workspace this month.
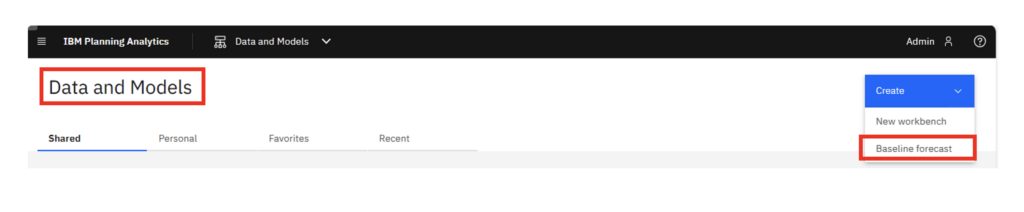
September: Baseline Forecast
Planning Analytics Workspace version 2.0.90 released functionality for administrators and modelers to create, share, and manage a baseline forecast with other users in the organization. Creating the baseline forecast includes setting a timeframe, defining scope, and defining optional advanced settings including whether or not to detect seasonality, setting a confidence-level, and more. Baseline forecasts are created in the Data and Models section and are accessible from both the Data and Models section and the Reports and Analysis section where those who have permission can run it. The baseline forecast can only forecast up to 8,000 rows.
October: N/A
IBM did not release a new version of Planning Analytics Workspace this month.
November: Git Integration (Cont.)
Planning Analytics Workspace version 2.0.91 expanded the ability of the Git repository integration (released in version 2.0.86 – April) now allowing users to migrate websheets and files along with cubes, dimensions, processes, chores, and particular control objects.
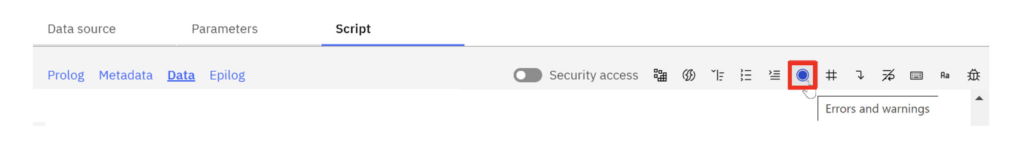
December: TurboIntegrator UX (Cont.)
Planning Analytics Workspace version 2.0.92 improved the TurboIntegrator user experience by:
- Improving the scrolling performance when scripts exceed a single page view.
- Improving the debugging process by introducing an error and warnings window that will display all script errors and allow users to navigate directly to the line producing the error.
- Improving the debugging process by introducing the ability to filter which variables are included when debugging.
- Introducing the ability to select all lines within a particular section (prolog, metadata, data, epilog) using Ctr + A
Looking for more Planning Analytics tips and tricks? Check out this blogpost, or get in touch with us to pick our brains!