
An Introduction to PAfE
IBM Planning Analytics for Excel (PAfE) is a Microsoft Excel add-in that empowers users to build sophisticated reports and perform ad-hoc analysis using real-time Planning Analytics data. The tool is favored by finance and accounting users who are comfortable with Microsoft Excel and frequently interact with the Planning Analytics data. The add-in offers five unique report types for users to create. Often times, users have a difficult time choosing the correct type based on their requirements. That being said, Data41 hopes to alleviate some of the difficulty by breaking down the report types below.
1. Exploration View
Exploration views are the simplest and quickest way to slice, filter, and analyze your Planning Analytics data. This report type provides drag-and-drop functionality for users to easily move dimensions around the rows, columns, and context area and are best used for ad-hoc analysis and investigation in a single cube. Users can drill-down on elements on the rows and columns, easily rearrange the dimensions, and save the view for future use. Explorations are frequently used to construct cube views that will later be converted into another report type.
See Exploration View Documentation here.
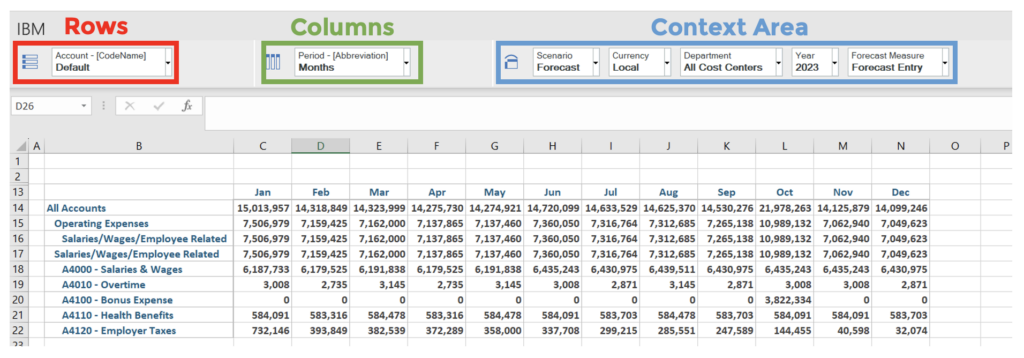
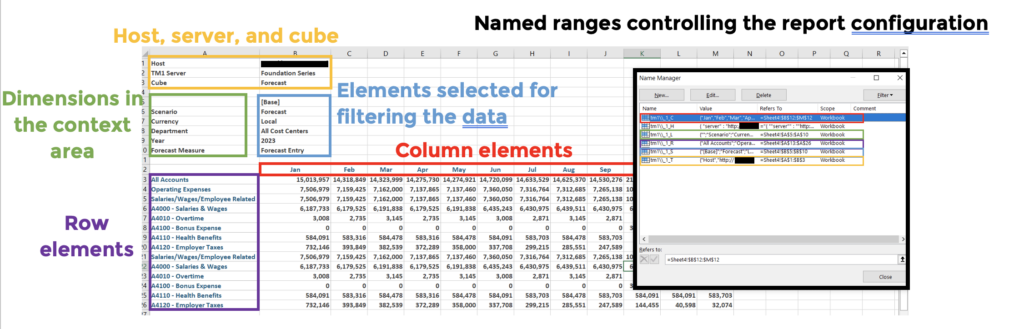
2. Quick Report
Quick reports are best used for standard reporting where the row and column definitions will not change. They are built through named ranges that define the components of the report, making these reports difficult to re-arrange once created. Users are able to create multiple quick reports deriving from different cubes and data sources on one worksheet, drill down in the rows and columns (must be enabled), and use Microsoft Excel functionality to enhance these reports. Quick reports do not contain any formulas which enables users to paste external data directly into the report for submission and access/share these reports offline (must re-connect to PA to submit changes).
See Quick Report Documentation here.
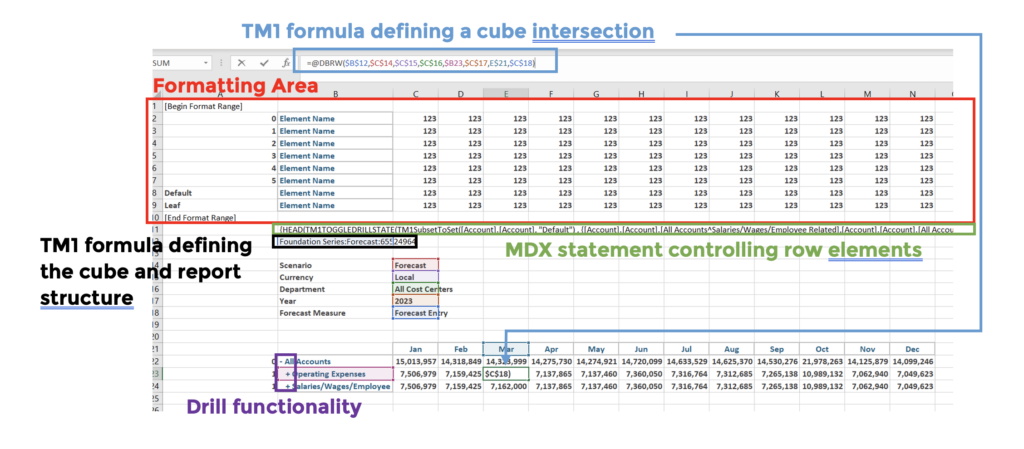
3. Dynamic Report
Dynamic reports are best used when creating complex reports where users need control over individual cells while still maintaining interactive report features. They are built through TM1 functions that define the formatting and composition of the report. Each cell uses a TM1 formula that pulls a specific intersection of a cube, making dynamic reports extremely flexible by allowing users to modify these formulas based on their requirements. Similar to quick reports, users can create and combine multiple dynamic reports deriving from different cubes and data sources on one worksheet. The row elements can be expanded and are driven by either an mdx statement or a subset. Any underlying alterations to the dimension or defined subset will automatically apply to the report rows. Microsoft Excel capabilities can further enhance these reports.
See Dynamic Report Documentation here.
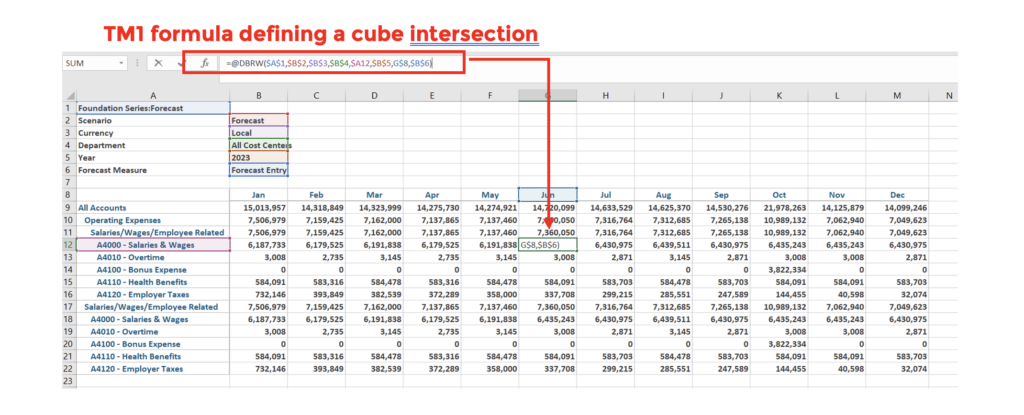
4. Custom Report
Custom reports are static reports best used when creating complex reports where users need control over individual cells without requiring interactive report features accessible on dynamic reports such as drill functionality, automatic formatting, and automatic row refinements based on underlying database changes. These reports can be created from scratch with unlimited configuration and formatting capabilities, can easily be re-arranged, and can use Microsoft Excel capabilities to further enhance them. They are powerful reports if they meet your business needs but can result in significant maintenance and time consumption if used inappropriately.
See Custom Report Documentation here.
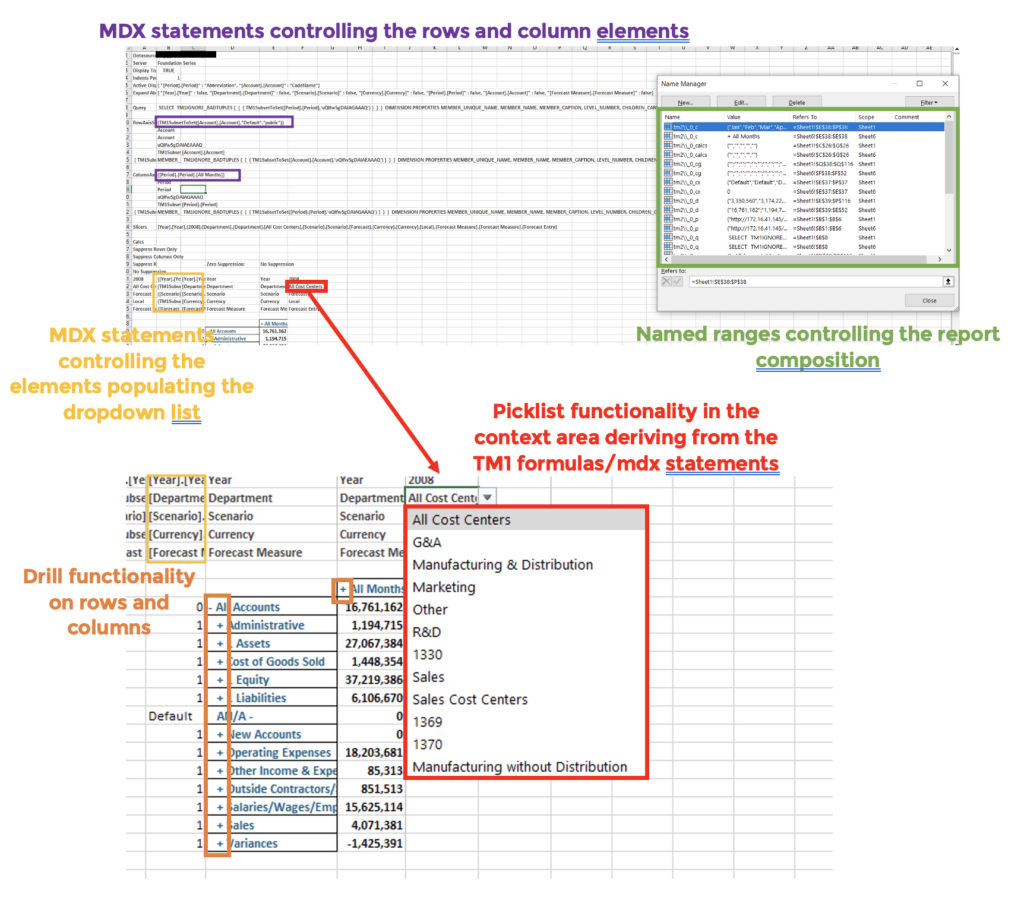
5. (New!) Universal Report
Universal reports were released in PAfE 2.0.90 in September of 2023. These reports can be thought of as an advanced quick report with some dynamic report functionality. They are built through named ranges and a combination of TM1Set/TM1SubsetToSet formulas. The TM1 formulas enable pick-list functionality for the dimensions in the context area where users can select an element from a dropdown list deriving from an mdx statement that can be modified. This report is hierarchy-aware, therefore the row and column elements can be expanded or collapsed. The row and column elements derive from mdx statements that can be modified. All underlying modifications to the dimension structures that make up the cube will automatically be detected and applied to the repot. Users are able to execute the same copy and paste functionality offered in quick reports, use Microsoft Excel capabilities to further enhance the report, and generate multiple universal reports on one worksheet (although unable to combine them).
See Universal Report Documentation here.
Conclusion
IBM Planning Analytics for Excel (PAfE) is an extremely beneficial tool when used correctly. Knowing which report type to create based on your requirements saves resources and expedites business decision-making as each report possesses distinctive advantages, limitations, and use-cases. If you are still having trouble deciding which report type to deploy or have any questions, please reach out to us here.